Mapping Competitive Biotech Landscapes with Embeddings
How we use embeddings of clinical trial features to visualize and analyze the competitive biotech landscape.
The biggest challenge when developing a new investment thesis or learning about a field is getting a lay of the landscape. What is out there? What are the big challenges, and who is working on them?
This issue is particularly acute when surveying competitive landscapes in biotech. Since 2020, there have been over 56,000 clinical trials initiated by nearly 10,000 entities on ClinicalTrials.gov. I started RxDataLab to investigate methods to stay on top of this competitive landscape. Here, I’ll discuss using clinical trial feature embeddings to visualize the competitive biotech landscape.
Interactive Visualization Available
Explore an interactive version of the competitive landscape map in this post.
Explore the Interactive VisualizationWhy Investigate Competitive Landscapes? #
On October 14, 2024 Lundbeck announced a deal to acquire Longboard Pharmaceuticals for its Developmental and Epileptic Encephalopathies (DEE) program. By the end of that day, Canadian biotech Bright Minds Biosciences (DRUG) rose nearly 3,800% from $1.10 to $38.49. Why?
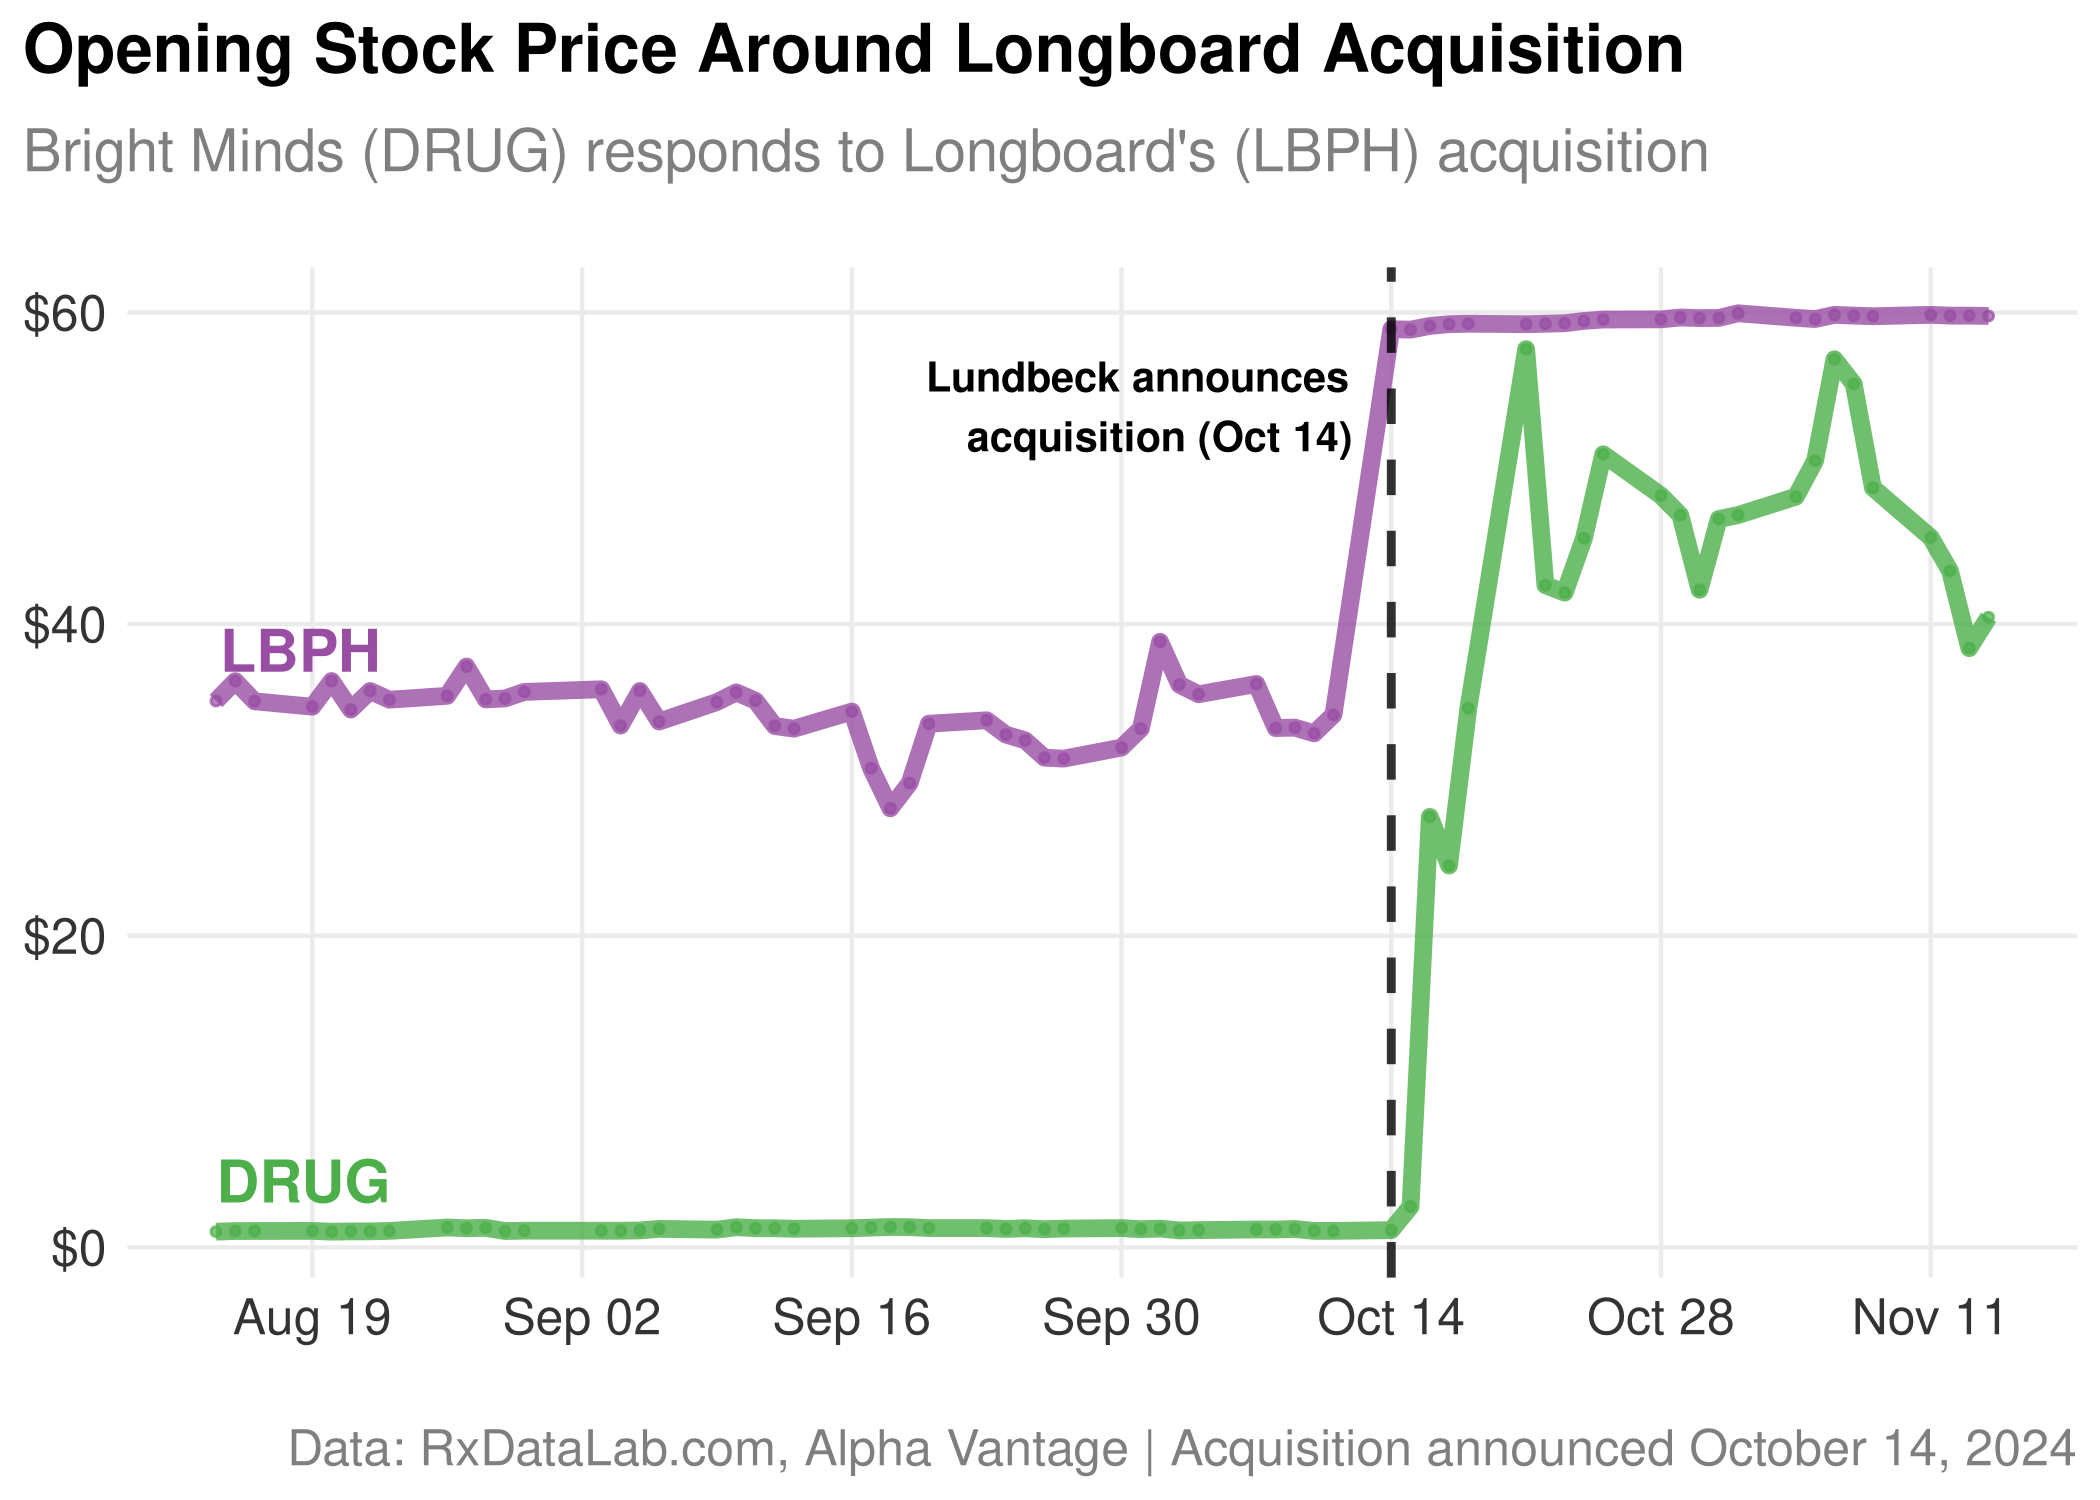
I wrote a short piece about Bright Minds and Longboard in June. The general consensus for why this happened seems to be that Bright Minds and Longboard were both working on a specific, unique class of rare developmental epilepsy therapeutics targeting 5-HT2c receptor (serotonin receptor subtype). If Lundbeck saw this promise and was willing to take over Longboard shortly after they initiated a Phase 3 trial, then Bright Minds would be a strategic portfolio addition given their similarity. The question is, how would you know these trials were similar if you weren’t deep in the 5-HT2c trial literature?
Tracking Biotech Trends #
It is clearly useful to have a systematic way to survey the competitive landscape of therapies or diseases, if only to be aware of up-and-coming areas outside your focus. Currently, analysts focus on a disease area or company, and survey the landscape starting from there. The survey typically consists of company funding databases, news releases/aggregators, or notoriously unreliable proprietary pipeline databases to track updates. In most cases, you’re left with questionable raw data to explore with keyword searches or existing lists of competitors.
The most sophisticated (public) method I’ve seen is from TechAtlas, the research arm of RA Capital. TechAtlas employs teams of MD’s and PhD’s to generate competitive landscape maps to support and inform their investment theses. The maps RA Capital shares publicly are stunning and comprehensive visual documents describing mechanisms, diseases, interventions, and major players and pipelines. Founder Peter Kolchinskly credits the visual presentation style with allowing analysts to get up to speed and communicate ideas and topics quickly in a vast and rapidly changing field.
While clearly effective, RA Capital’s approach is also resource- and time-intensive to generate. This type of work isn’t amenable to quickly exploring landscapes and ideas. What if I had a hunch and wanted to quickly know who was working on siRNA trials? Keyword searches can help, but might hide similar approaches that don’t directly match. So if we’re interested in a company or trial, how do we generate an unbiased map of its competitive landscape?
Embedding Models #
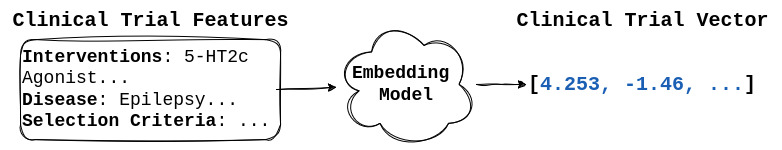
Embedding models are machine learning models that convert input (text, images, or audio) into vectors representing the semantic meaning of the input.
For example, an embedding describing a clinical trial for an Alzheimer’s therapy will be more similar to an embedding describing a clinical trial for Parkinson’s disease than to one describing a trial of a cardiovascular device. Embeddings are the foundation of retrieval-augmented generation (RAG) techniques that power many LLM applications, such as grouping related documents or finding relevant studies in response to a question.
Can embeddings help us map and understand a competitive landscape?
Generating Biotech Embeddings #
I created embeddings using publicly available clinical trial data of roughly 28,000 studies. Rather than simply embedding the trial intervention or disease type, I generated embeddings for different combinations of features. The examples discussed here are a combination of patient populations, interventions, diseases, and clinical outcomes. To control the file size of the plots I’m only show a sample of about 15% of the full data I clustered.

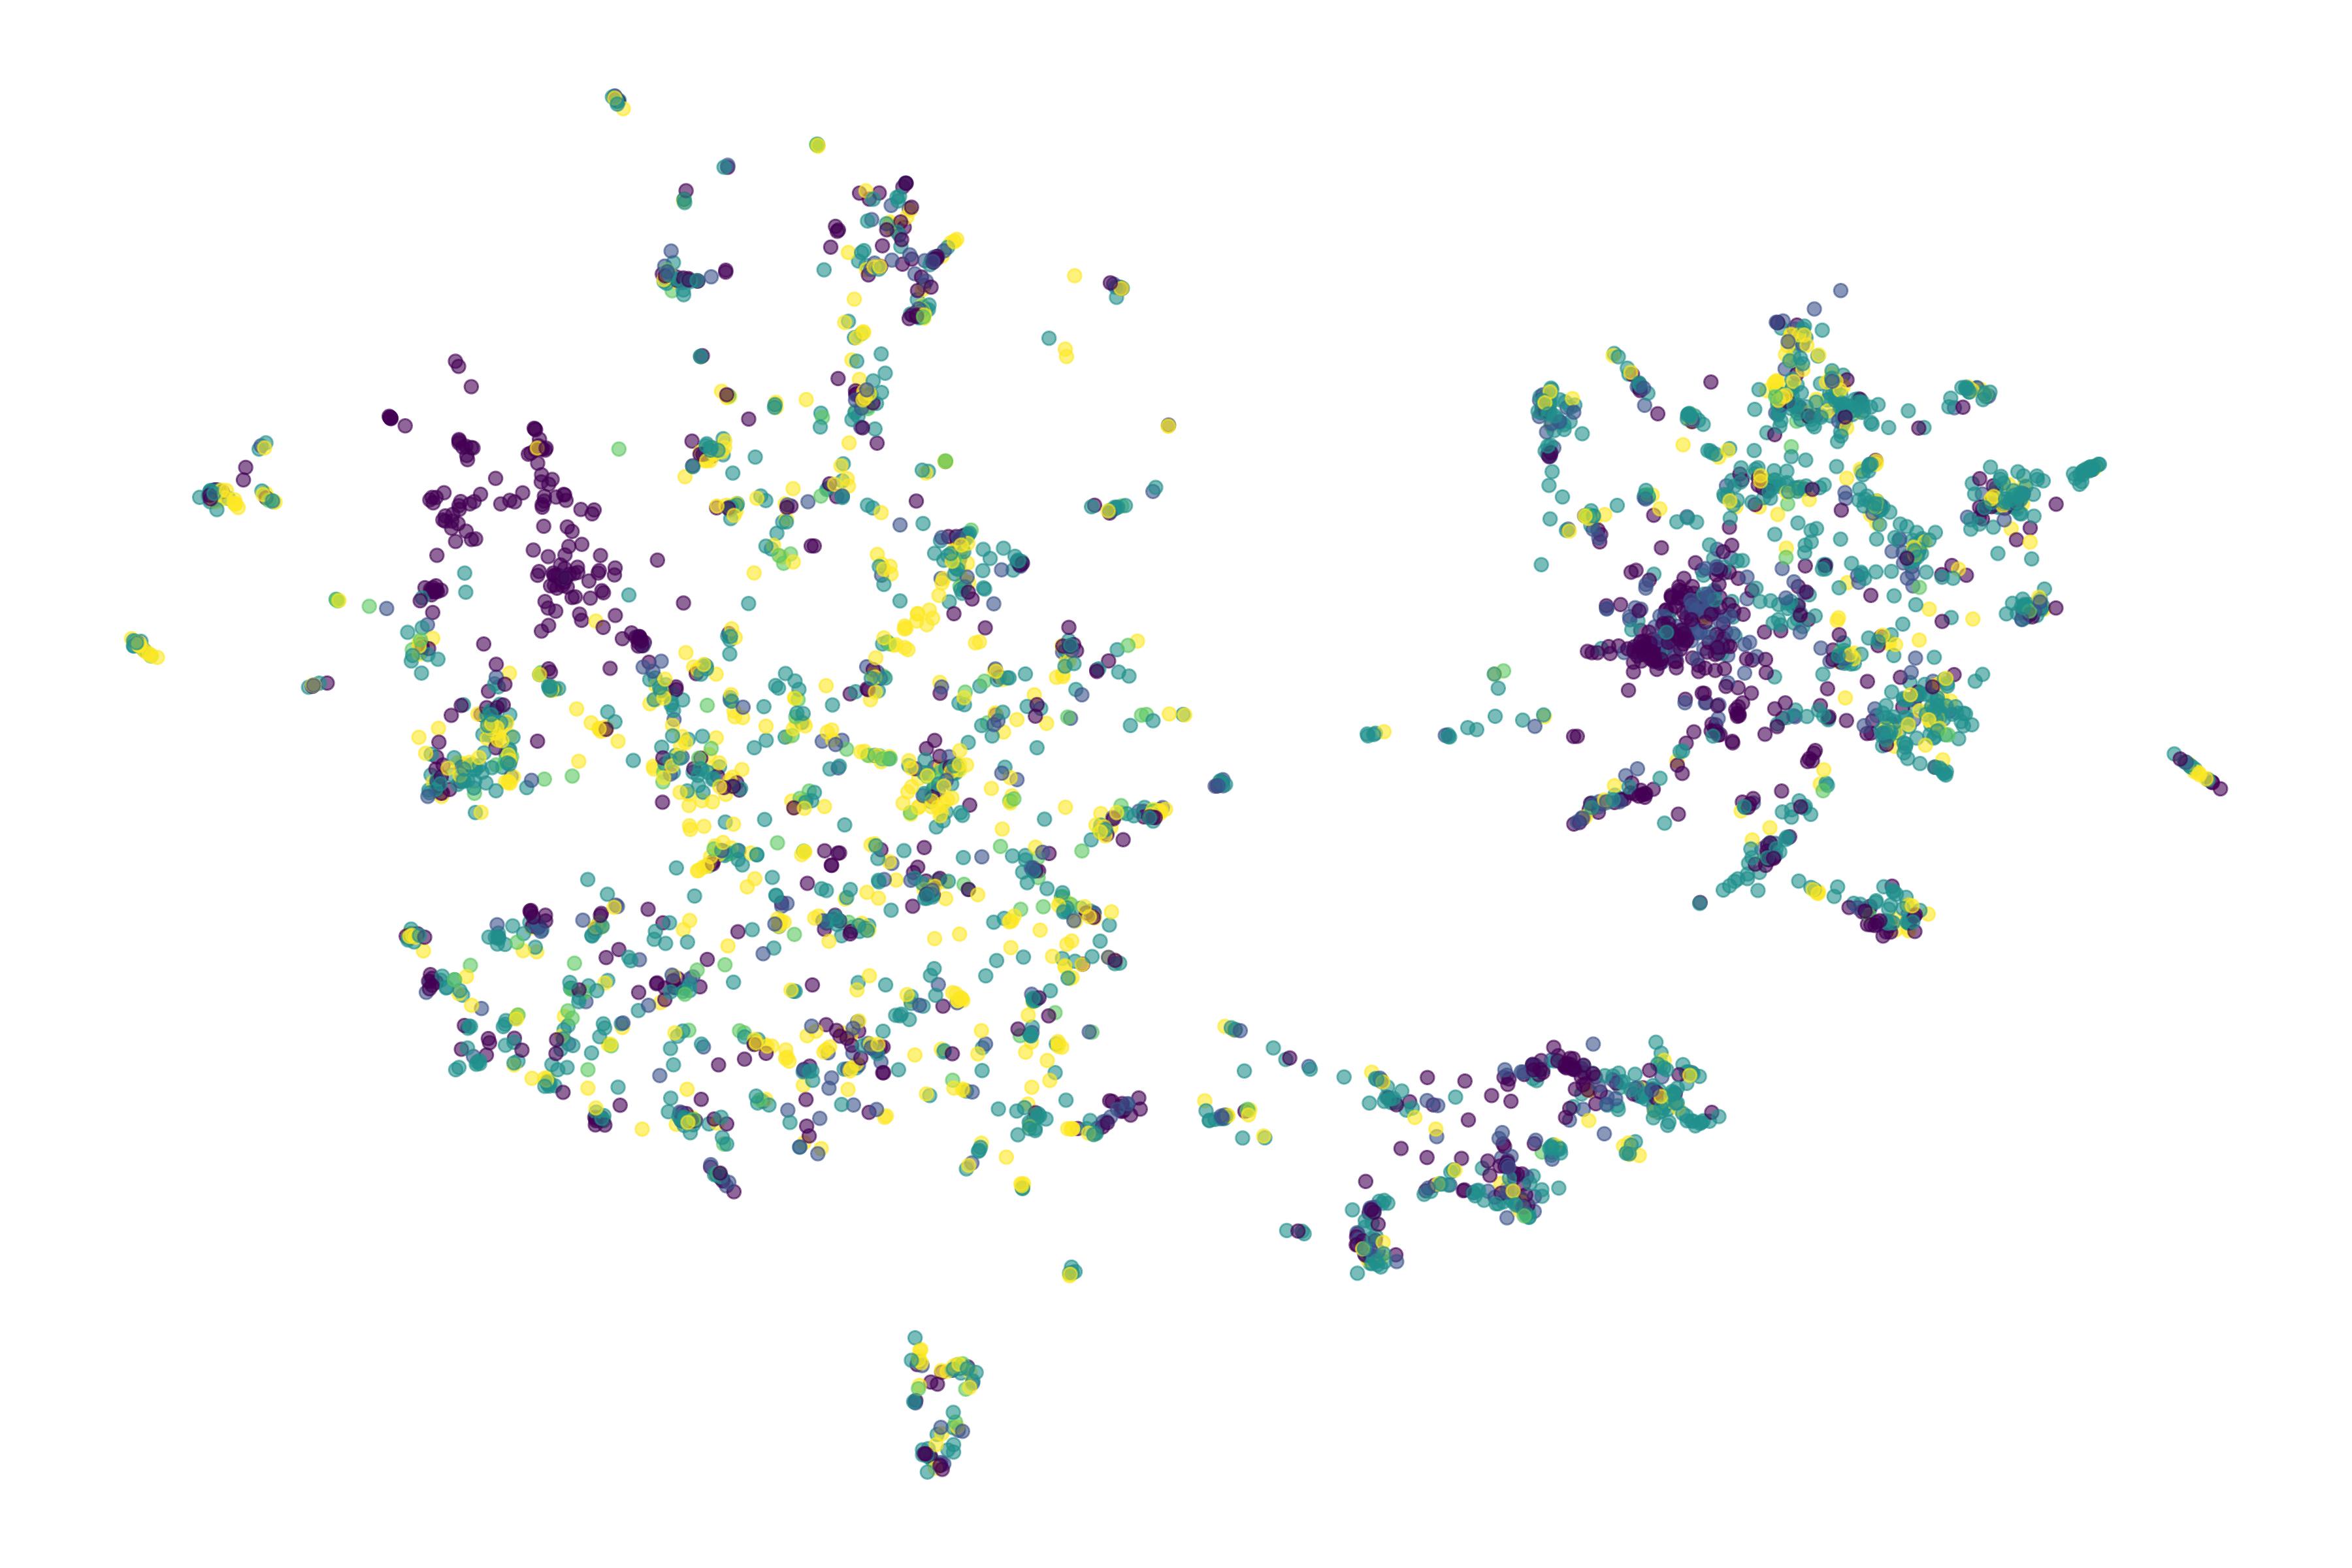
To generate an unbiased landscape of trials I created a uniform manifold projection (UMAP) clustering of the embeddings and colored by trial phase. This should reveal trials that are similar to one another, but likely spanning different therapeutic approaches, diseases, or other features.
I’ve colored the UMAP above by trial phase. You can see that Bright Minds does indeed cluster near Longboard’s trial, with a cosine similarity of 89%.
Exploring the Landscape #
This type of projection wouldn’t have necessarily inspired me to purchase Bright Minds, and companies that were even more similar to Longboard didn’t exhibit a stock jump like Bright Minds did. What this projection does do, is give me a starting place to see where the field that Bright Minds and Longboard operate is. Once I generate the map, I can overlay other features. For example, phase in the plot above can show you “up and coming” cluster that are primarily Phase 1. Overlaying information about trial sponsors can indicate how much commercial interest exists in an area, for example showing regions that are primarily academic focused vs commercial.

For example, in the UMAP above, there is more academic activity (grey) in the Cerebrovascular (stroke) cluster (magenta highlight), while a set of rare neurogenetic diseases (green) is more industry dominated (blue). This is an interesting pattern that likely has to do with rare and orphan disease incentives stimulating commercial interest. This type of map could be used to find academic partnership opportunities or choose areas of the landscape that aren’t heavily commercialized.
Using the Maps #
One useful feature of these competitive landscape maps is that they provide the ability to do an unbiased scan of an area. By overlaying features, we can see licensing opportunities (similar trials from academia), and get an overview of how competitive an area is. You can also create more targeted map, for example one that shows the landscape for a certain therapeutic area or for the studies most similar to your trial.
Competitive landscape maps like these are not final products, but rather starting points. They won’t predict the next blockbuster, but they will help you understand more about the environment you are operating in and enable further research.
These embedding maps are just the beginning of RxDataLab’s process. I’ve created an interactive map showing a sample of this data, you can find it rxdatalab.com/resources/competitive-biotech-landscape-embeddings/ an interactive map for this exercise.
Interested in a map of a trial you’re interested in or the full data? Want to dive deeper with a custom report? Contact me or send me an email ([email protected]) and sign up for my list to keep up.
RxDataLab
Get the data behind the analysis
We deliver primary-source biotech datasets for BD teams, investors, and the AI tools they're building. Tell us what you're tracking.
or email [email protected]