Introducing the Drug Exclusivity Dashboard
Drug exclusivity is an important metric to track when monitoring pharma portfolios. RxDataLab has created a dashboard to monitor estimated drug patent and exclusivity expiration in the US.

Drug exclusivity refers to the period of time when laws and regulations grant a monopoly to brand name drugs. Exclusivity periods are meant to spur the development of new drugs by providing financial incentives to companies that invest in development. Once exclusivity expires, generic competitors quickly enter the market and drive the price down significantly. In fact, a 2004 study of the emergence of generic Prozac (Fluoxetine) showed that the generic had overtaken brand name Prozac in market share within two weeks of release, and within a year the cost of Prozac was $2.40/capsule vs $0.32/capsule for generic Fluoxetine1.
While meant to spur/reward innovation, exclusivities have also proven to be easily game-able incentives and some companies fight2 to extend and maintain exclusivity through various legal and business maneuvers rather than focus on innovation.
Tracking Drug Exclusivity #
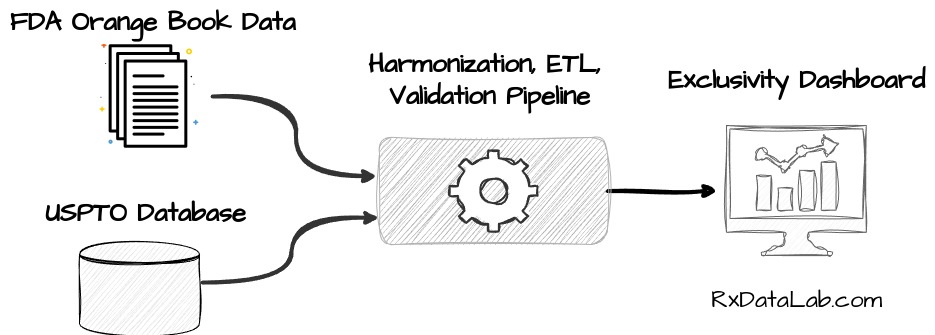
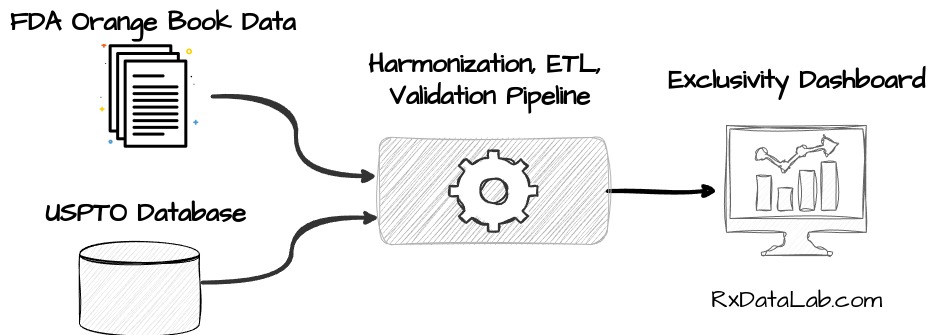
Following drug product exclusivity is an important factor when evaluating a pharmaceutical company’s portfolio. However, the information relevant to calculating exclusivity is spread between the FDA’s Orange Book and patent information from the US Patent and Trademark Office (USPTO). We’ve recently created a data pipeline that regularly ingests data from FDA and USPTO and adds it to our internal database, allowing us to provide an ongoing, unified view of the exclusivity landscape in the US3.

Insights and Trends from Exclusivity Data #
By harmonizing and ingesting this data, we are able to learn about the data in new ways. For example, we can see which companies have the most “at risk” drug products over the next five years based on our data.

The Exclusivity Dashboard is provided free of charge, and we hope this view of the data is useful. As we continue harmonizing data sources, we will expand and enhance the contents of this dashboard and others, providing a more comprehensive view of the landscape of the US pharmaceutical industry.
The 2004 study used insurance billings from AdvancePCS, the largest Pharmacy Benefit Manager at the time. The data is striking– Eli Lilly’s Prozac lost majority market share within two weeks and within a year the cost of Fluoxetine dropped from $1.91/capsule to $0.32/capsule. The price of the brand name Prozac actually rose during this period from $2.25 to $2.40/capsule.
Druss BG, Marcus SC, Olfson M, Pincus HA. Listening to generic Prozac: winners, losers, and sideliners. Health Aff (Millwood). 2004 Sep-Oct;23(5):210-6. doi: 10.1377/hlthaff.23.5.210. PMID: 15371387. ↩︎
AbbVie was accused of establishing “patent thickets” consisting of hundreds of patents to maintain their monopoly on the hugely profitable Biologic Humira. When AbbVie saw the end was near, they raised the price 60% over 7 years and netted $114 Billion. See extensive coverage in the NY Times https://www.nytimes.com/2023/01/28/business/humira-abbvie-monopoly.html and Wikipedia https://en.wikipedia.org/wiki/Adalimumab#Patent_litigation ↩︎
The Hatch-Waxman Act of 1984 ammended the Food Drug and Cosmetics Act and established the modern system of generic drug regulation, including formalizing many of the incentives available today https://en.wikipedia.org/wiki/Drug_Price_Competition_and_Patent_Term_Restoration_Act. See our post on exclusivity in the US for a summary of exclusivity protections https://rxdatalab.com/blog/fda-exclusivity/. ↩︎
